1.6 Phase Diagrams
Substances exist in a certain phase (solid, liquid, gas, etc.) depending on factors such as temperature or pressure. For example, water is a liquid at room temperature at sea level but is a solid at temperatures below 0 °C at the same pressure. A phase diagram illustrates the phase of a substance depending on things like temperature and pressure. Pressure-temperature diagrams are sometimes called p–T diagrams.
Phase diagrams can be very complex. In general chemistry, these diagrams tend to be straightforward and relate the phase of a pure substance depending on pressure and temperature.
A phase diagram of pure carbon is given below.1
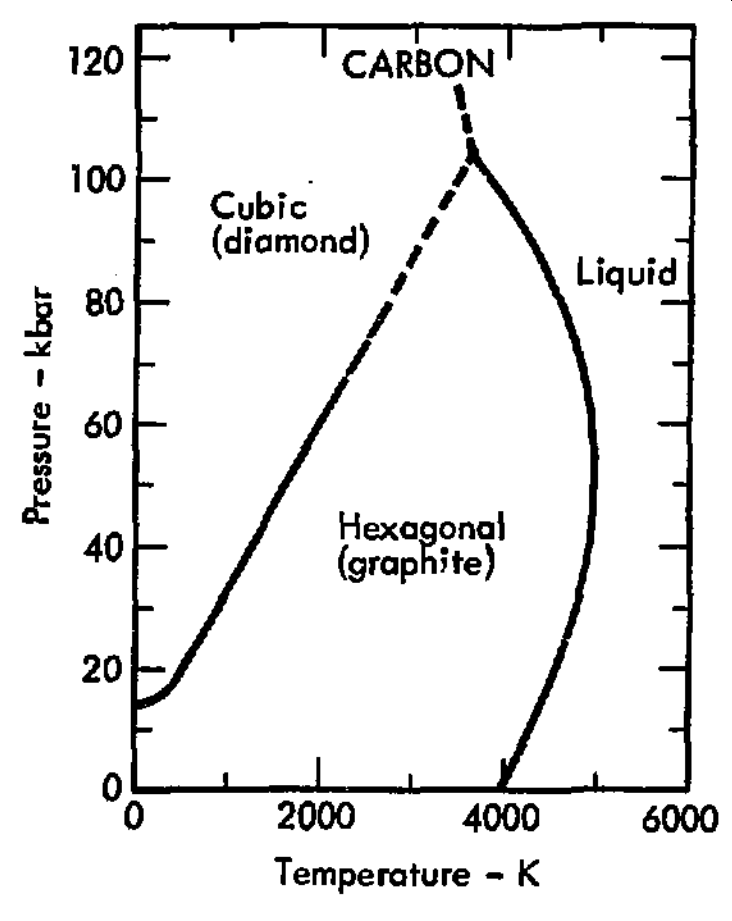
Figure 1.20: The p–T diagram for carbon
Carbon is mainly a solid across a wide range of temperatures and pressures. The form of the network covalent solid changes depending on the pressure. At lower pressures, carbon adopts a hexagonal structure and is known as graphite. Note the layers of covalently bonded carbons. The layers (or sheets) are attracted to other sheets via weaker van der Waals forces (i.e. non-covalent interactions).
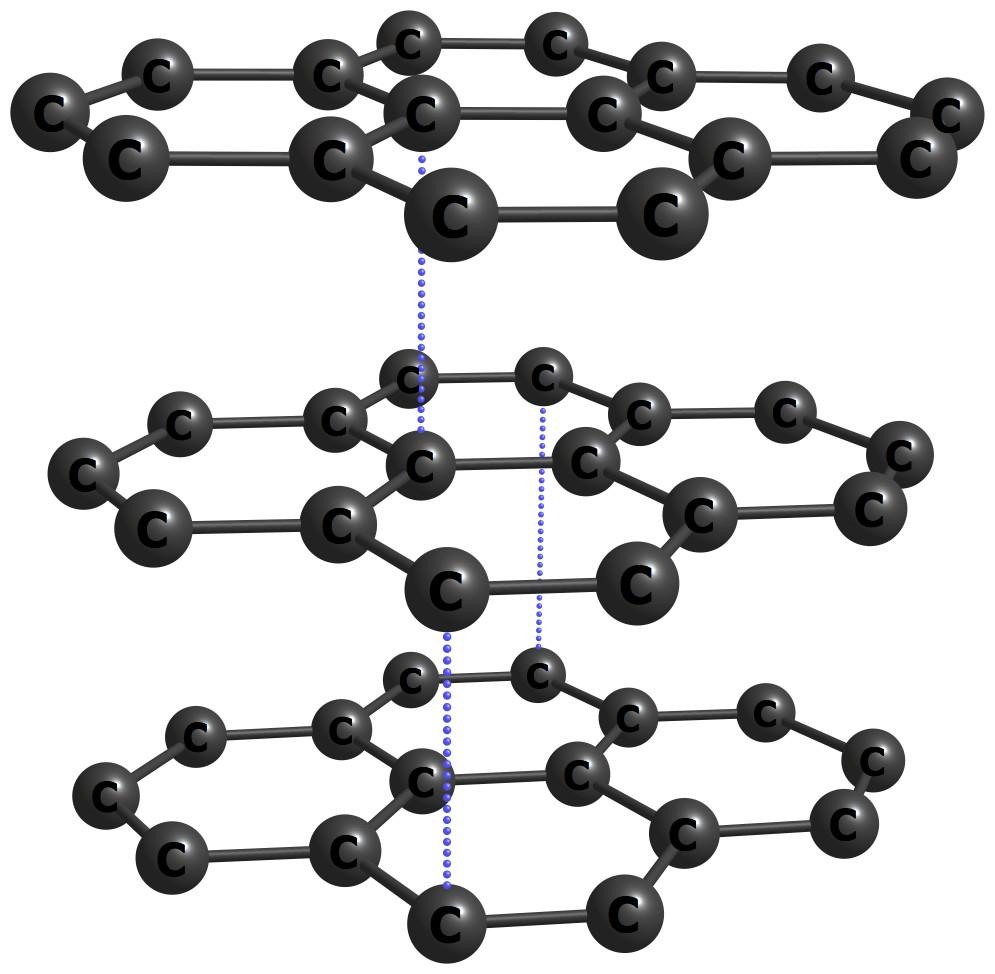
Figure 1.21: Carbon (graphite) solid - dashed lines included for perspective
At higher pressures, carbon adopts a cubic structure known as diamond. Here, each carbon atom is covalently bound to four neighboring carbon atoms giving rise to a very hard solid.
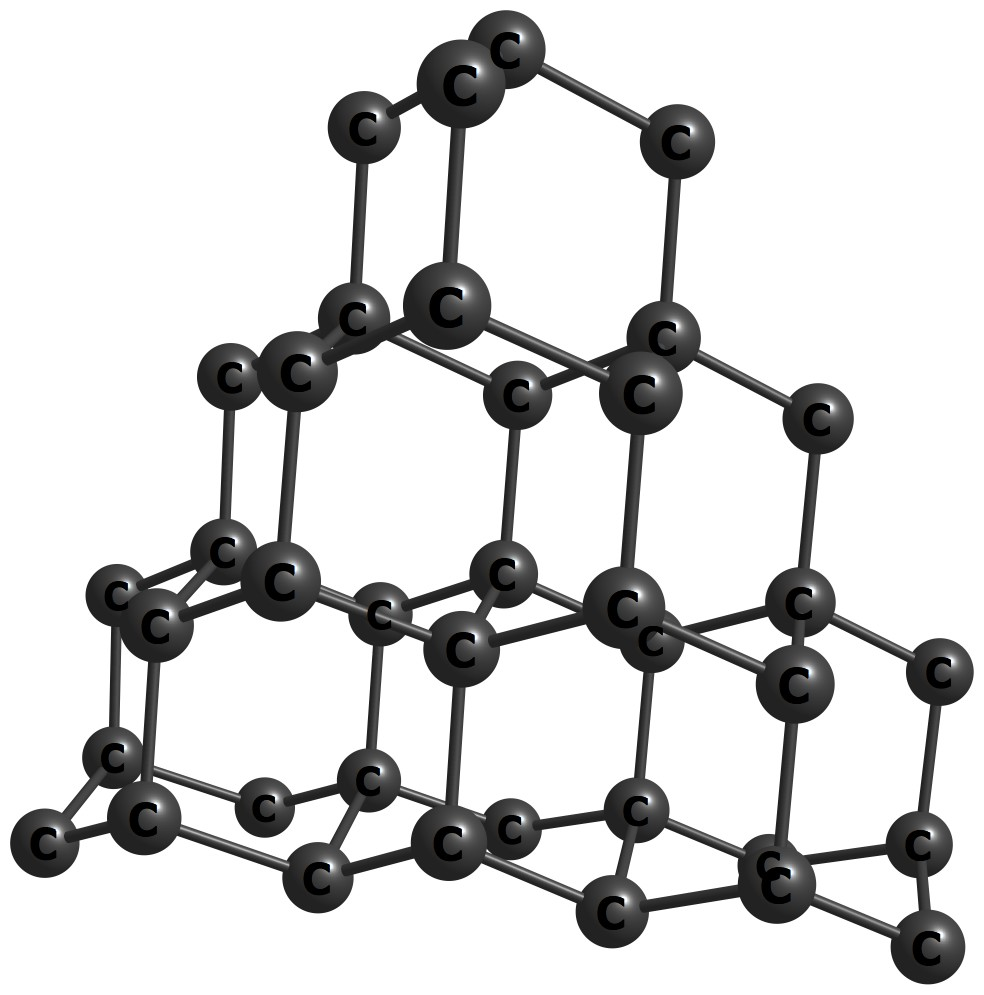
Figure 1.22: Carbon (diamond) solid
The boundaries that separate the phase regions on the phase diagram are phase-boundaries. These relate to the phase transition between different states or types of matter. For example, the solid black line at 0 kbar and 4000 K in Fig. 1.20 is the phase boundary separating solid carbon graphite from a liquid. This boundary is directly related to melting/freezing, the phase transition that occurs when a substance transitions between a solid and liquid. Carbon has many melting/freezing points depending on the temperature or pressure chosen. For example, Carbon melts at approximately 5000 K when the pressure is 50 kbar. Carbon also melts at 4000 K when the pressure is almost 100 kbar.
Practice
Provided is the phase diagram for elemental nitrogen.1
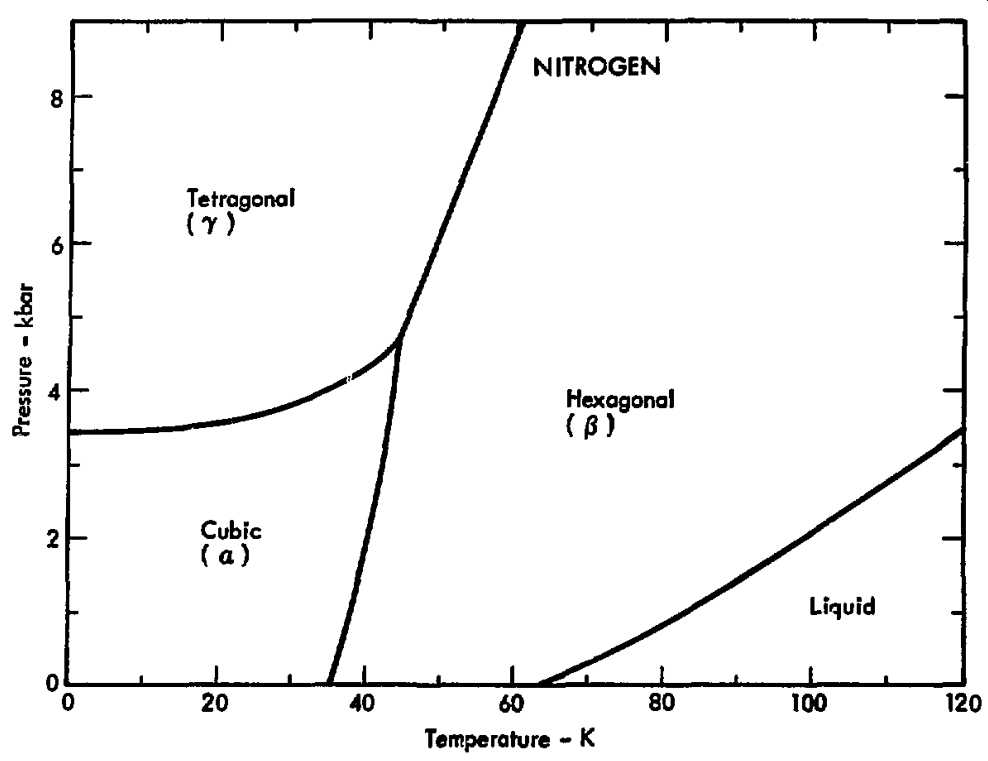
Figure 1.23: The p–T diagram for nitrogen
What is the state (and type) of matter of elemental nitrogen at
- 6 kbar and 20 K
- 6 kbar and 100 K
- 1 kbar and 100 K
Solution
- solid (tetragonal)
- solid (hexagonal)
- liquid
The phase diagram for water is given below and introduces a few new features.2
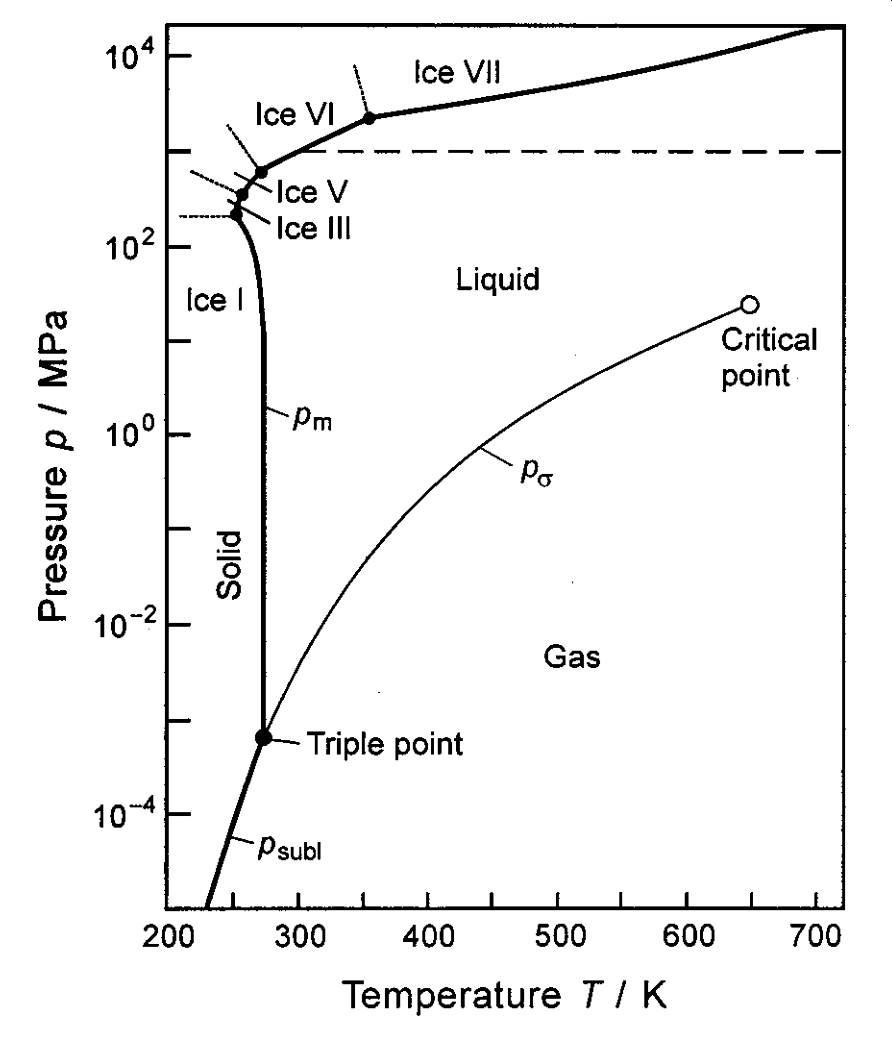
Figure 1.24: The p–T diagram for water
The triple point is the point at which a substance can exist in all three states of matter (solid, liquid, and gas). For water, the triple point exists at a temperature of 273.16 K and a pressure of 611.657 Pa.
The critical point is the end point of a phase equilibrium curve. For water, the liquid-vapor critical point lies at the end of the liquid-vapor curve. This is the point at which both liquid and vapor can co-exist. The critical temperature for water is 647.096 K and the critical pressure is 22.064 MPa.
At (and beyond) the critical point, only one phase exists. The heat of vaporization for any substance is zero at its critical point. Above the critical point, a substance becomes a supercritical fluid (SCF), a type of state that exhibits both the properties of a liquid and a gas. For example, an SCF can effuse through porous solids (like a gas), has a low viscosity (of a gas), has a high density (of a liquid), can dissolve materials, and has no surface tension. SCFs cannot be liquefied no matter how much pressure is applied.
An expanded version of the phase diagram of water is given below.
](files/ch10/phase-diagram-water-wikipedia.svg)
Figure 1.25: An expanded p–T diagram for water. Source: Wikipedia
Practice
Provided is the phase diagram for carbon dioxide (Source).
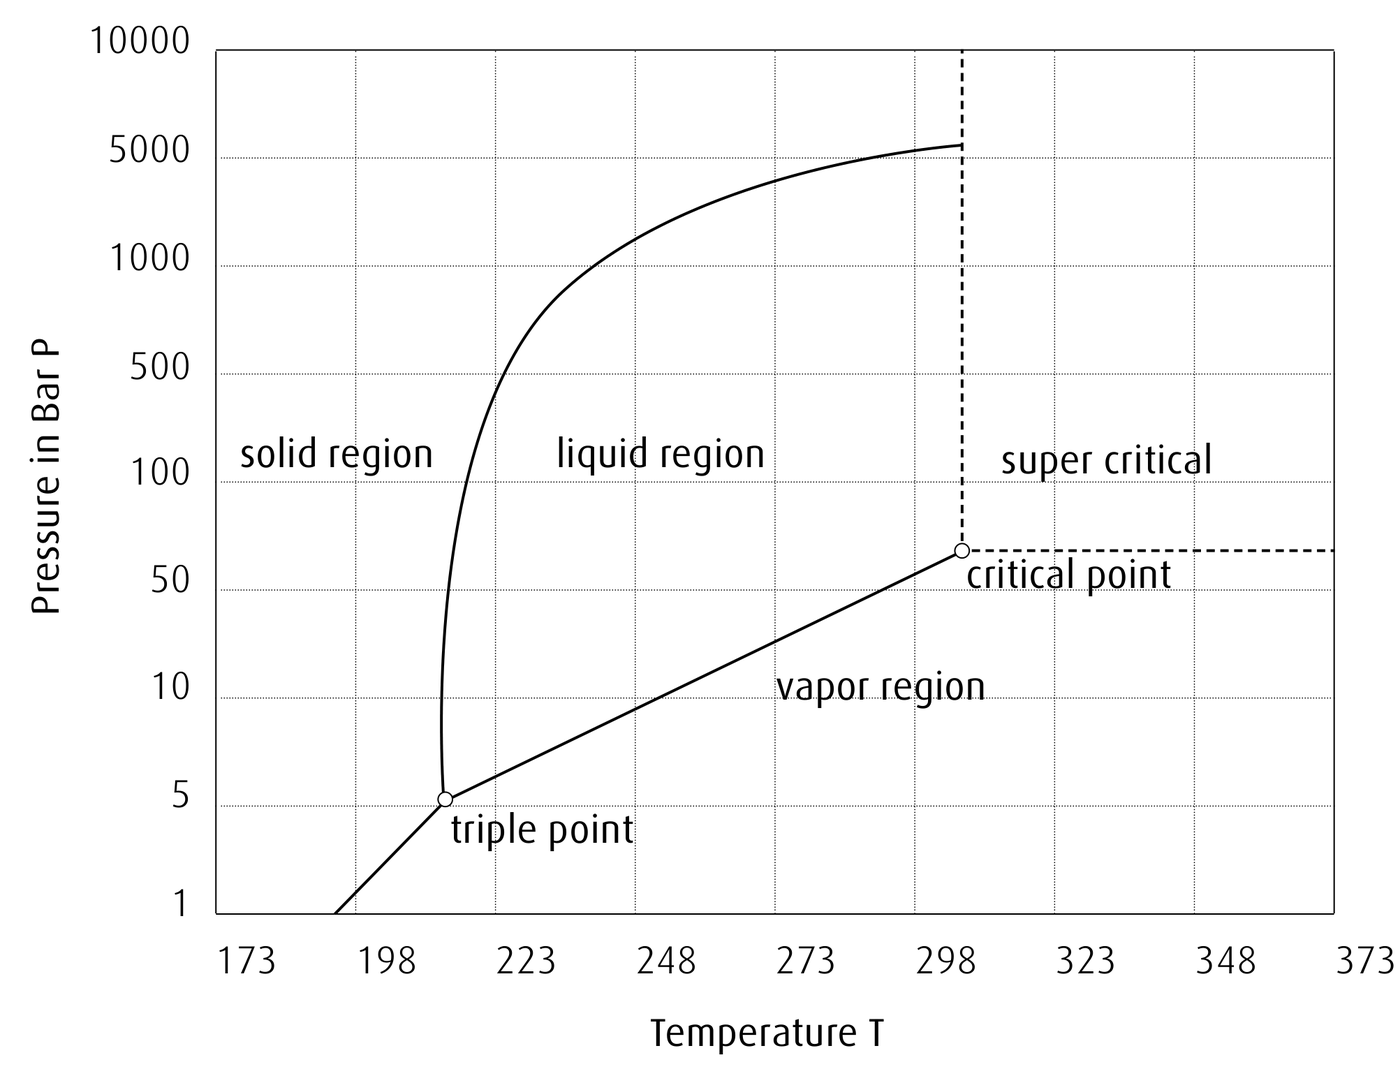
Figure 1.26: The p–T diagram for carbon dioxide
Does CO2 have a normal freezing point and/or normal boiling point?
Solution
Freezing is defined as the phase transition between a solid and liquid whereas boiling is the phase transition between a liquid and a gas. Normal freezing and boiling points are referenced to 1 bar of pressure. At 1 bar, CO2 sublimates from a solid to a gas at 194 K (or –78 °C).
The normal freezing/boiling points of CO2 are often cited as this sublimation point and the temperatures are identical.