4.4 Visualizing Q and K
Imagine a “reaction line” ranging from reactants (left) to products (right). Anywhere between the limits of the line represents a mixture of reactant and products.

A reaction can “exist” anywhere along this line. It can adopt any ratio of products to reactants. Now, imagine that we have a reaction that is ready to occur (it has not started yet; we have only reactants and no products.
\[\mathrm{reactants} \longrightarrow \mathrm{products}\]
The reaction quotient, Q, would exist all the way to the left. Imagine Q as a movable slider such as one found on an audio mixing board, or a slider on your car’s climate control panel. It can move along the reaction line (left and right).
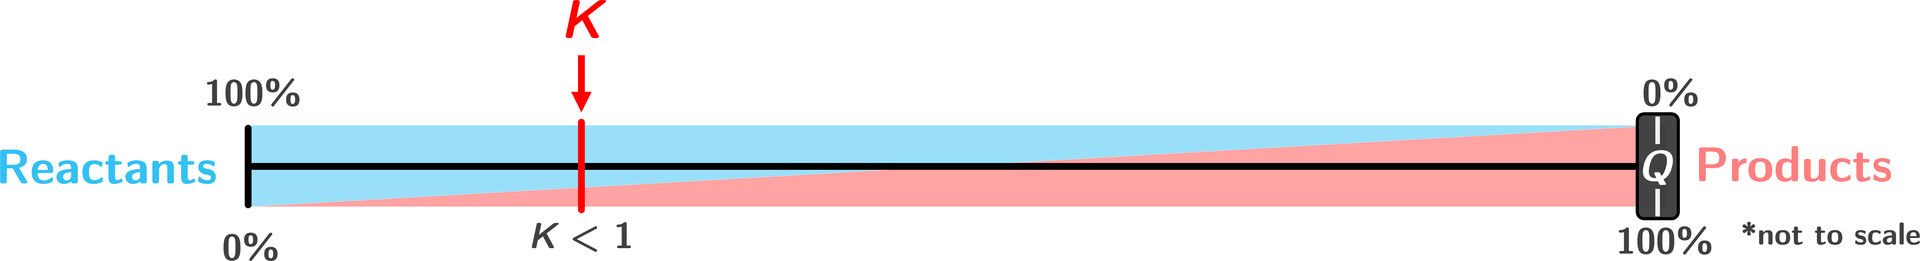
Now, this hypothetical reaction has an equilibrium constant, K, under some conditions, that is small (less than 1). We map out Q and K on our reaction line below.
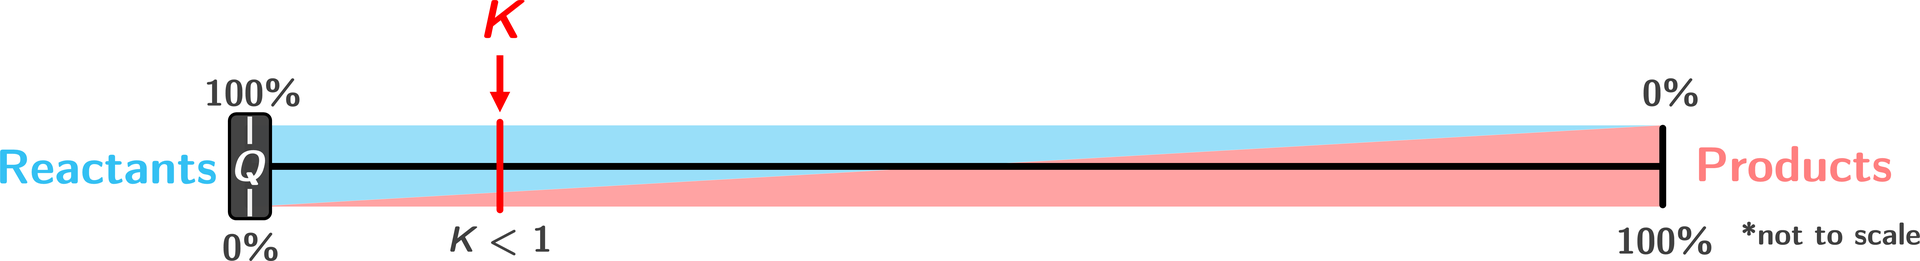
Notice the location of Q (all the way to the left as we have no products yet, the reaction is yet to start). Notice the location of K. Since K < 1, the reaction is “reactant favored” meaning, at equilibrium, there are more reactants than products.
Now we begin the reaction. The reaction proceeds and it proceeds “to the right”. Q begins to slide to the right. It cannot proceed left because there is no product yet with which to turn into reactant. A driving force pushes the reaction right to form product. This force is opposed upon the creation of product. The opposing force balances the driving force when equilibrium is reached (i.e. when Q reaches K).
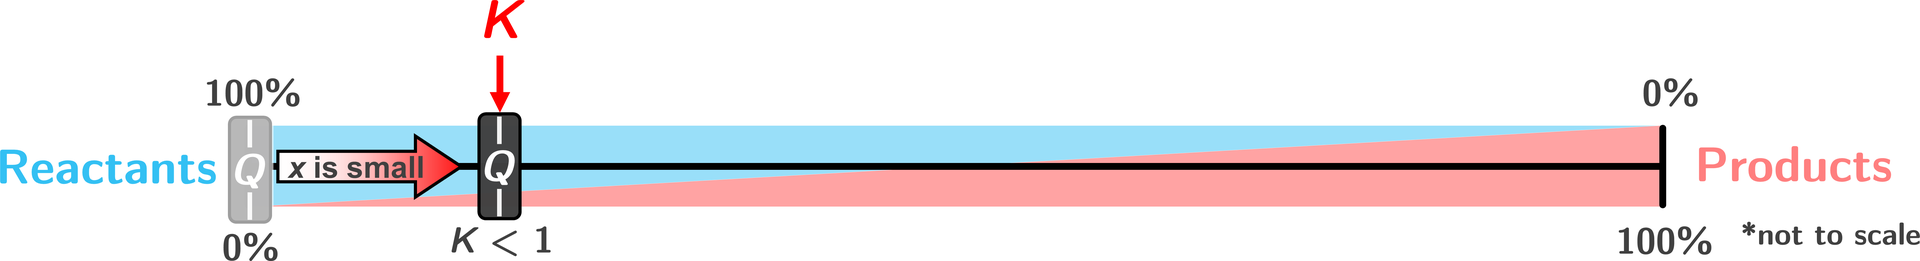
When Q reaches K, the reaction does not stop. It continues in both directions making reactants and products. However, the change in the amount of reactants and products are equal.
Next, notice how far Q had to move to reach equilibrium, K. It only moved a small amount relative to going all the way to products. I refer to this distance as x and x ends up being “small” since Q started near K. This distance represents the amount of reactants that were converted to products.
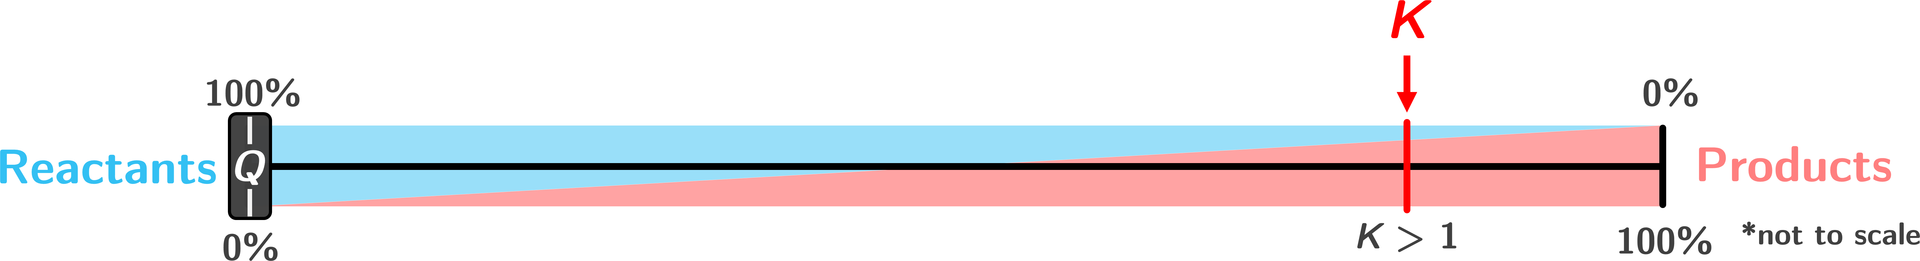
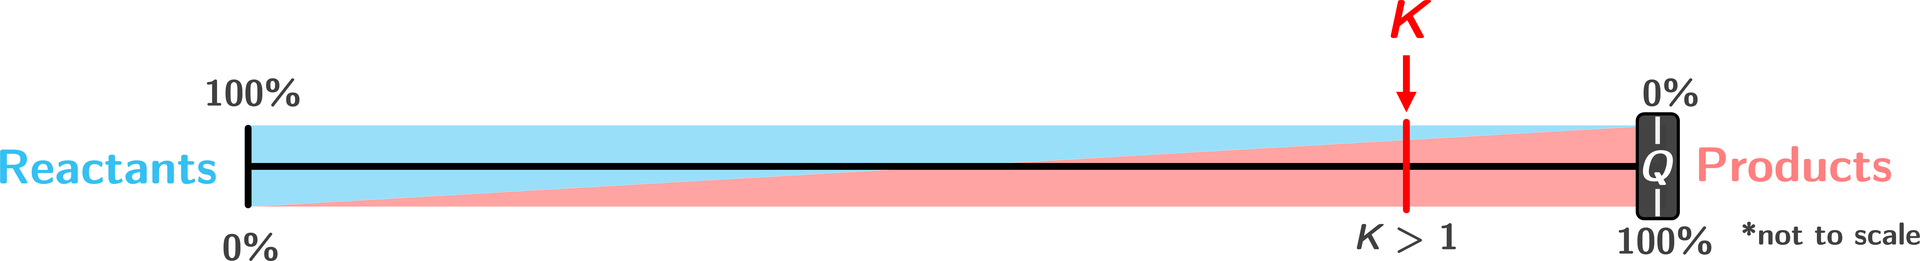
Let’s try this again. Consider another hypothetical reaction where K is large. We start the reaction with all reactants. Note the positions of Q and K. Here, K is large (> 1) and the reaction is product favored (i.e. at equilibrium, there are more products than reactants).
The reaction begins and the reaction proceeds to the right (Q moves right). The reaction progresses until Q equals K.
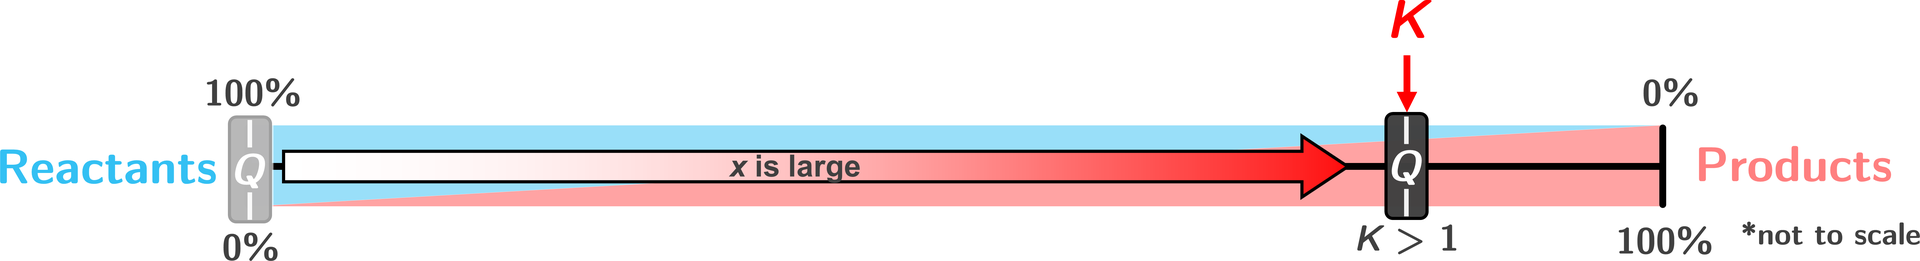
We see that Q traveled a further distance (more reactants were converted to products before equilibrium was reached). I refer to this as x being “large” since Q started far away from K.
Starting with Product
Let us visualize this hypothetical reaction, with K < 1, once again but this time we start with all product. This changes the position of Q. Now it is located all the way to the right. K is less than 1 so it sits closer to reactants.
The reaction begins and proceeds to the left. Q moves left until it reaches equilibrium, K.
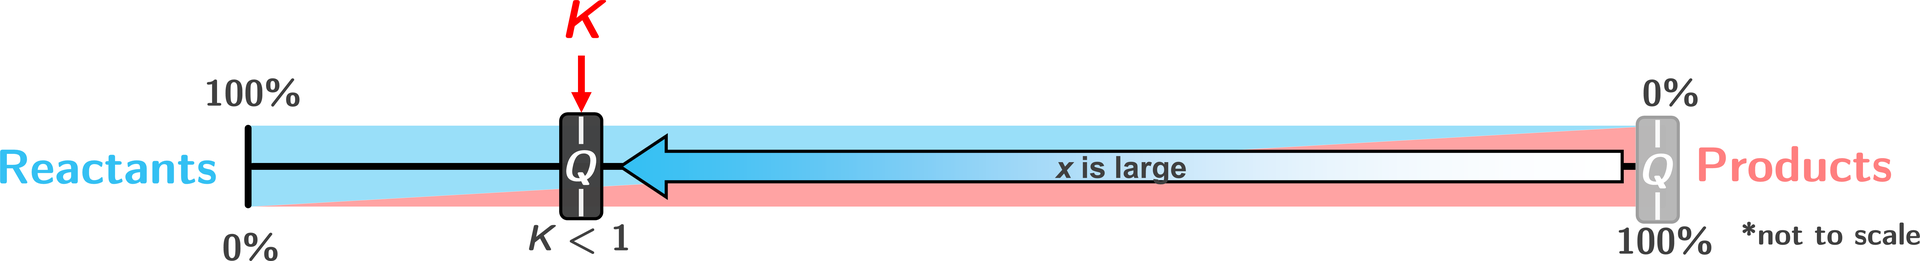
Notice the magnitude of x now; it is large since Q started far away from equilibrium.
If K were large (> 1) for this reaction, we get the following starting positions
and the following result to reach equilibrium.
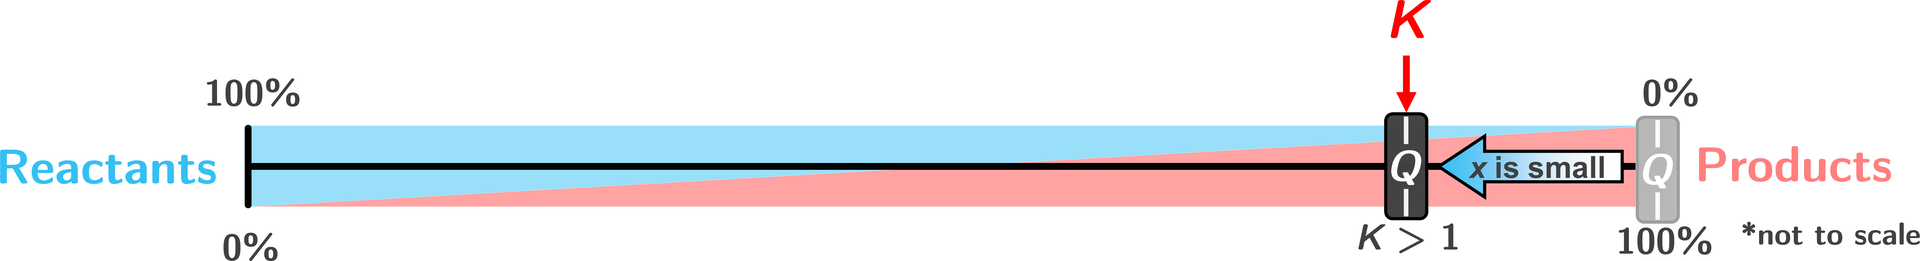
In this case, x is small since Q started close to equilibrium.
Direction of Reaction
We can determine which way a reaction will proceed (toward equilibrium) by identifying where we begin the reaction and where K is.
If starting with all reactants, the reaction proceeds right.
If starting with all products, the reaction proceeds left.
If starting with a mixture of reactants and products
- If Q < K, the reaction proceeds right
- If Q > K, the reaction proceeds left
Summary:
- Visualize K and where it would exist on the reaction line
- Visualize where the reaction begins (e.g. where Q is)
- Determine which direction the reaction will proceed (left or right) by comparing Q to K
- Visualize how far Q has to move to reach K (e.g. how big x is)