9.4 Stability of Nuclei
We can see from the image below (adapted from LibreTexts.org) that light elements undergo fission to produce energy (you see their binding energies per nucleon increase) and heavy elements undergo fusion to produce energy (their binding energies per nucleon increase).
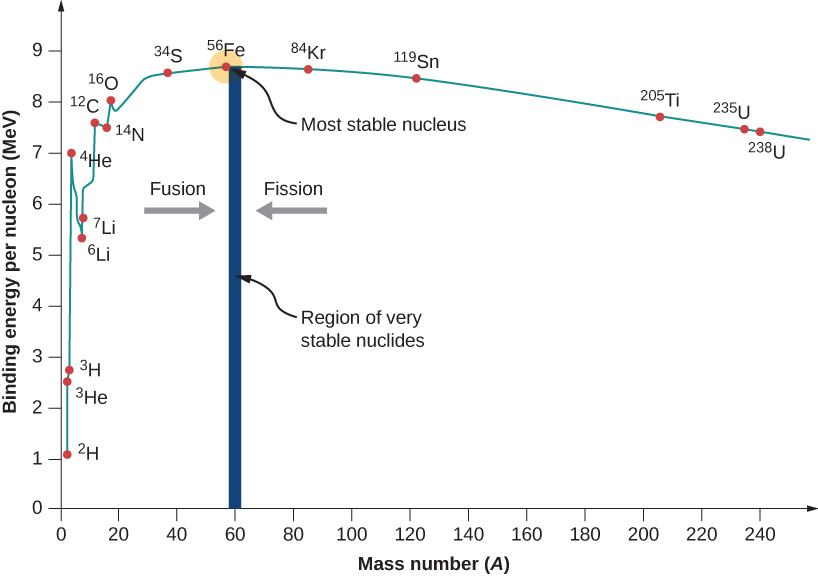
Figure 9.2: Binding energy diagram for various isotopes.
Iron-56 is one of the most stable nuclei as it has one of the largest nuclear binding energies (its nucleus is very tightly bound). Its binding energy is about 8.8 MeV/nucleon.
Nuclear decay processes follow first-order kinetics. Recall the first-order kinetics equations from Ch. 12 (see below). These equations modified to reflect number of nuclei (N) rather than concentrations since nuclear reactions occur outside of solution.
9.4.1 Belt of Stability
We can create a plot of all known isotopes by comparing the number of protons (Z) to the number of neutrons (N). Using color to convey half-life, we can visualize a “belt” of isotopes that are stable (shown in black).
)](files/ch21/HalflifeNuDat2.png)
Figure 9.3: Nuclides and their half-lives (Image from Wikipedia)
Notice the stable isotopes that are flanked by unstable isotopes. The further away we move from the stable isotopes, the less stable the nuclides are.
We can also visualize the radioactive decay processes that these isotopes will undergo.
)](files/ch21/DecayModeNuDat2.png)
Figure 9.4: Nuclides and their decay process (Image from Wikipedia)
as well as the binding energies of the nuclides.
)](files/ch21/BindingNuDat2.png)
Figure 9.5: Nuclides and their binding energies (Image from Wikipedia)